 Strengthening your supply chain one link at a time.
Many government economic indexes are released each month and investors, economists, and business professionals look to these indicators as guides to the future direction of the economy. The relationship between a logistics index and the main measure of the US economy is an example of one those guides. The two indexes for this topic are the Freight Transportation Services Index (Freight TSI) and Gross Domestic Product (GDP).
The Freight Transportation Services Index (Freight TSI)
The Freight Transportation Service Index is a component of the Combined Transportation Service Index (TSI) which also includes the Passenger Transportation Service Index. The Freight TSI and the Passenger TSI make up the Combined TSI. The Freight TSI is the focus of this analysis.
The Freight TSI is a monthly measure released by the U.S. Department of Transportation’s Bureau of Transportation Statistics. This index measures the monthly changes in for-hire transportation in ton miles of freight. The modes included are for-hire trucking, rail, inland waterways, pipelines, and air freight. For-hire is the key word in this description as the index does not include private trucking, courier services, or the U.S. Postal Service. The TSI is seasonally adjusted to remove regular seasonal movement and to reflect the dollar contribution of each transportation mode to the economy.
The data for this monthly index comes from a wide variety of sources such as the American Trucking Association (ATA) for trucking, Association of American Railroads (AAR) for rail, Waterborne Commerce Statistics Center of the U.S. Army Corps of Engineers for inland waterways, and the U.S. Department of Transportation, Bureau of Transportation Statistics, and Office of Airline Information for airlines among other smaller sources.
The Gross Domestic Product (GDP)
The GDP is a common measure of the overall economic health of the US and measures the value of total final output of goods and services produced. This index is released quarterly. Revisions of GDP occur each July and are also revised annually as more data is accumulated that is too late for the quarterly and July revisions.

The relationship between the Freight TSI and GDP
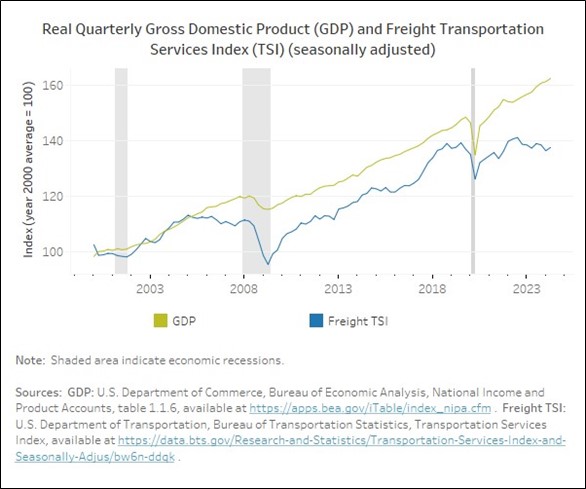
The above chart illustrates the relationship between the Freight TSI and GDP. The TSI measure of freight volume is a reactor to, and is a predictor of, the economy. As consumer activity increases the demand for goods there is a natural increase in demand for transportation that moves these goods. This activity and thus the Freight TSI act as a gauge of the current economy.
The index can also foreshadow the GDP changes. For example, if manufacturers increase production in anticipation of increased demand for their product the need for inbound and outbound transportation in the form of raw materials and finished product distribution also increases. Thus, the predictive feature of the Freight TSI.
Another example of the correlation between the GDP and Freight TSI indexes is highlighted in the chart when there is a recession. Note the gray shaded areas in the chart indicating recessions in the economy where activities in both the Transportation and GDP indexes trend downward. The 2020 pandemic is good illustration of this correlation with large decreases and then subsequent rebounds in both indexes.
Recent results of the Freight TSI and the GDP show both indexes increasing as the economy sees an increase in growth despite relatively high interest rates and predictions of a recession.
How can businesses use this information?
Businesses can use this macro level economic data to help guide strategic and tactical decisions for the future. Using the TSI Freight and GDP indexes can help gauge future demand and anticipate future economic changes. This could be helpful to help project business needs such as warehouse space, transportation capacity or staffing. Another example is that one could also use these two indexes together to help monitor current and future transportation performance in the area of carrier service and cost. These two indexes are not in themselves crystal ball predictors, but used as pieces of additional information allows for business to make better decisions.
—Tom Schaefges, St. Onge Company