![]()
![]() Strengthening your supply chain one link at a time.
Strengthening your supply chain one link at a time.
A useful set of government economic indexes to help logistics business professionals plan for the future are the Freight Transportation Services Index and Inventory to Sales Ratio. The comparison of these two indexes can bring unique business planning insight. Let’s examine how these two economic indicators can be used.
Inventory to Sales Ratio
The government reported Inventory to Sales Ratio measures retailers amount of inventory held compared to the net sales. Inventory levels are cumulated end of month values and the net sales are total sales for the month. The formula is [Inventory Level] / [Net Sales]. This monthly index is seasonally adjusted.
A high Inventory to Sales ratio value indicates there are higher inventory levels relative to sales—meaning retailers have an excess amount of inventory. A lower ratio value indicates the opposite—that inventory is lower and companies are efficiently converting inventory into sales. A value of 2.5 indicates that retailers can cover 2.5 months of sales.
The Freight Transportation Services Index (Freight TSI)
The Freight Transportation Service Index is a component of the Combined Transportation Service Index (TSI) which also includes the Passenger Transportation Service Index. The Freight TSI and the Passenger TSI make up the Combined TSI. The Freight TSI is the focus of this analysis.
The Freight TSI is a monthly measure released by the U.S. Department of Transportation’s Bureau of Transportation Statistics. This index measures the monthly changes of for hire transportation in ton miles of freight. The modes included are for-hire trucking, rail, inland waterways, pipelines, and air freight. For-hire is the key word in this description as the index does not include private trucking, courier services, or the U.S. Postal Service. The TSI is seasonally adjusted to remove regular seasonal movement and to reflect the dollar contribution of each transportation mode to the economy.
The data for this monthly index comes from a wide variety of sources such as the American Trucking Association (ATA) for trucking, Association of American Railroads (AAR) for rail, Waterborne Commerce Statistics Center of the U.S. Army Corps of Engineers for inland waterways, and the U.S. Department of Transportation, Bureau of Transportation Statistics, Office of Airline Information for airlines among other smaller sources.
The relationship between the Freight TSI and Inventory to Sales Ratio
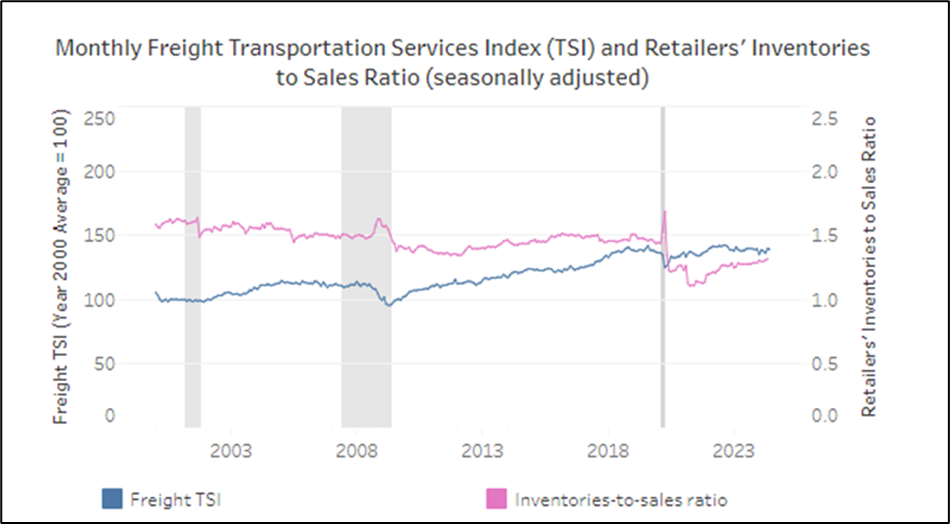
The above chart illustrates the relationship between the Freight TSI and Inventory Sales Ratio. The pink Inventory to Sales line has taken a noticeable adjustment relative to the blue TSI Fright index. The chart shows from 2000 through 2020 continuing through the pandemic inventories were higher than desired.
The period 2000 to 2020 also shows that as a result of a high sales to inventory ratio there was less freight transportation was used. This highlights the relationship. Retailers are using less freight when inventories are high.
Immediately after the pandemic in 2020 inventory levels were a major focus for businesses. Businesses were consistently looking for ways to reduce excess inventory as a result of the supply chain bottlenecks during the pandemic. The spike in 2020 reminds us of the inability for business to get orders because of plant shutdowns, port congestion, and warehouse challenges, etc. Thus, extra amounts of safety stock compensated for the inability to get timely shipments. But after the pandemic the focus on reducing inventories paid dividends as there is now an efficient balance between inventory and sales. Many factors were involved in this change of inventories—one being the emphisized focus by company executives on inventory levels to the bottom line.
The TSI Freight rebounded after the pandemic and has continued to increase. This shows that retailers are using more transportation as business sales are robust.
How can businesses use this information?
The Inventory to Sales ratio can provide insight for businesses in different ways. When inventory levels were higher pre-2020 and during the pandemic, warehouse lease rates (i.e. dollars per square foot) also cost more simply because of the lack of supply of warehouse space. Many companies had extra inventory and the need to store it somewhere. At this time inventory cost and warehouse space rates were indicators for companies to get an understanding and develop a plan warehouse space needs as a result of their bloated inventories.
As the inventory levels post pandemic become more efficient relative to sales logistics executive now can feel comfortable with their inventory levels and thus warehouse space needs. Warehouse space has now become more obtainable and warehouse lease rates have also stabilized and started to come down. Using this index, one could identify this current period as an opportunity to closely look at warehouse space and warehouse lease rates.
The Freight TSI shows a steady increase in ton miles. The Freight TSI and GDP indicate a stable growth rate even during these time of higher interest rates. In a previous blog I discuss the correlation of the Freight TSI and GDP. The Freight TSI is both a predictive indicator to GDP, or a reactive measure depending on the timing of the indexes and the business cycle at the time.
Using both the Inventory to Sales ratio and the Freight TSI one can be confident that the Inventory to Sales Ratio decrease is not the result of businesses pulling back inventory levels because of slower economic activity or slower future production because of the anticipated slowing of the economy. The Freight STI shows that transportation activity remains robust and inventory levels with the Sales to Inventory Ratio in a relative stable period. These two economic indicators are important pieces of information to help businesses plan for the future.
—Tom Schaefges, St. Onge Company