![]()
![]() Strengthening your supply chain one link at a time.
Strengthening your supply chain one link at a time.
What is the PMI?
The PMI is a survey of U.S. manufacturing companies published by the Institute for Supply Management (ISM), a nonprofit supply management organization. It serves as a key indicator of the U.S. economy’s health from a manufacturing perspective.
The index is compiled based on survey responses from executives at more than 400 companies across 20 industries. These industries include Food, Beverage & Tobacco Products, Textile Mills, Apparel, Electrical Equipment, Appliances & Components, Transportation Equipment, Primary Metals, Computer & Electronic Products, Petroleum & Coal Products, and Fabricated Metal Products, among others. Companies are selected based on their contribution to the nation’s GDP.
The survey focuses on assessing business conditions, including factors such as new orders, production, employment, supplier deliveries, and inventories. The PMI is released on the first working day of each month, providing timely insights into economic trends and manufacturing activity.
Components of the PMI
The PMI is calculated based on five key surveys conducted among U.S. manufacturing companies. Each component is equally weighted at 20% and is seasonally adjusted to account for fluctuations. The five survey categories are:
The PMI is considered a diffusion index where the index shows how the data of these five survey results are dispersed or spread out. Companies report whether specific business activities have increased, decreased, or remained unchanged compared to the previous month. A PMI reading above 50 signals expansion, while a reading below 50 indicates contraction. A value of 50 suggests no change. The distance above or below 50 represents the relative strength or weakness of the manufacturing sector.
Within these surveys are ten sub-indexes that can be classified as Demand, Output, or Input indicators. These sub-indexes provide additional insight to how sectors of the surveys performed. Below are the sub-indexes and their respective indicator type:
Each of the 10 sub-indexes are released in the same format of the overall PMI—above 50 indicates expansion and below 50 indicates contraction.
PMI results for January 2025
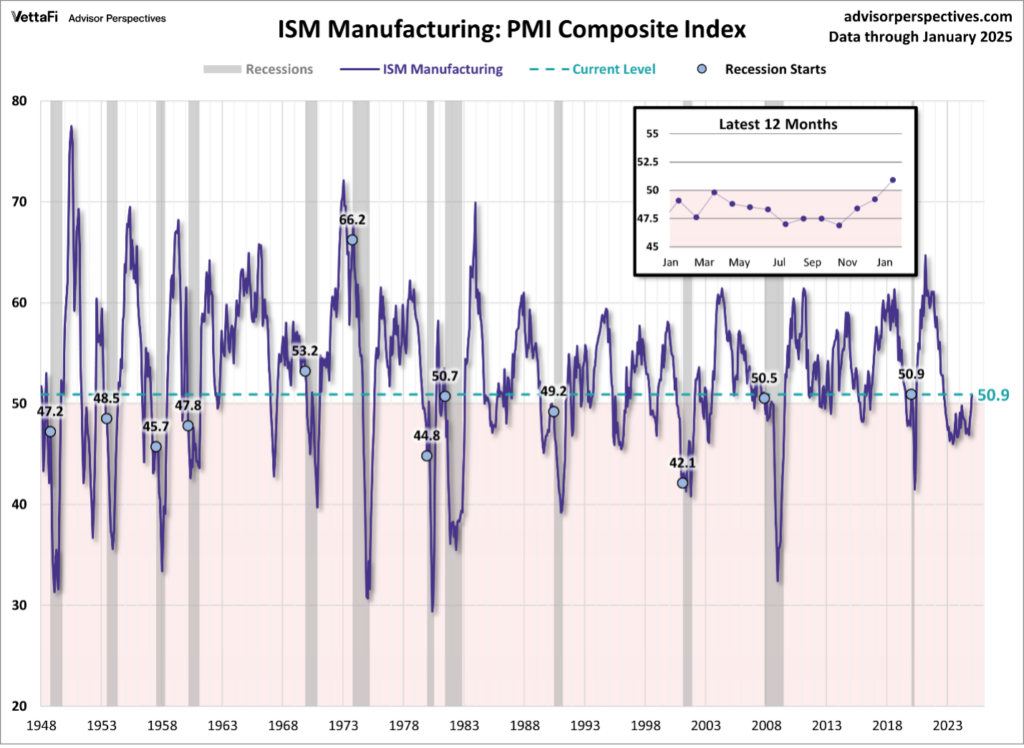
The January PMI recorded a 50.9 reading, reflecting a 1.7-point increase from December. This marks the first expansion in the U.S. manufacturing sector in over two years, signaling a positive shift for the economy.
The chart below presents historical PMI data since 1948, with recessions highlighted in gray. A rising PMI indicates economic growth, while sharp declines often serve as a leading indicator of downturns, pointing to contractions in manufacturing activity, weakened business confidence, and slowing economic momentum. This latest uptick suggests a potential rebound in the sector and broader economic strengthening.
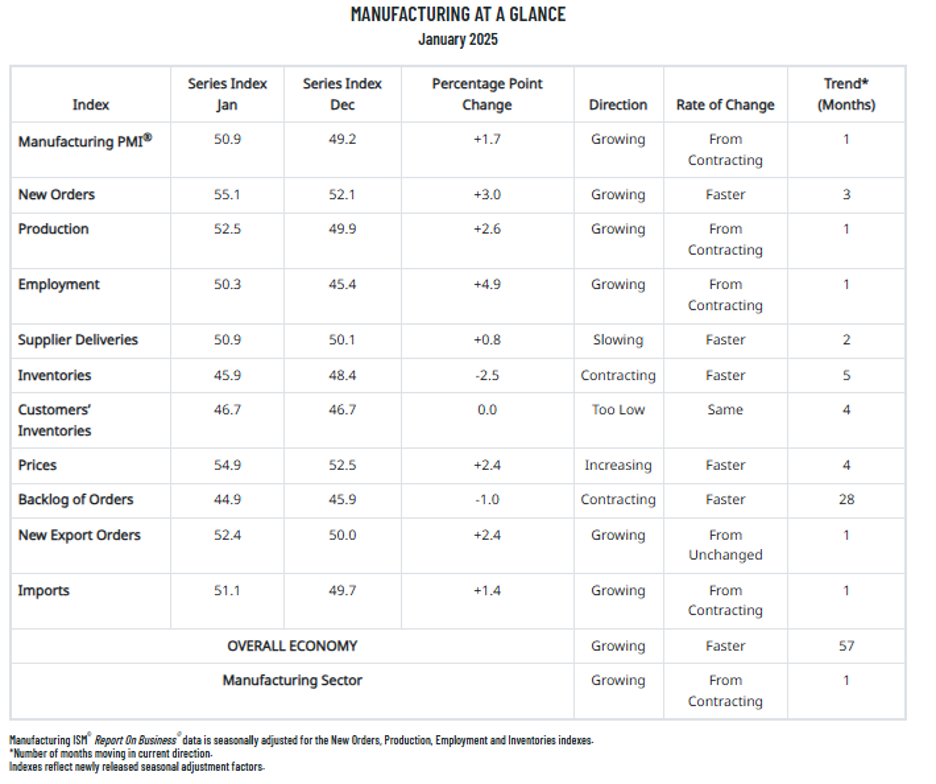
Looking at the 10 sub-indexes of the PMI one can get insight into the sectors that show strength. Below are December highlights:
The positive numbers for New Orders, Production, Employment and Supplier Deliveries were in expansion territory above 50. Production and Employment were in negative territory in December. However, the 2.4-point increase in Prices raises concerns about rising costs and potential inflationary pressures.
Conclusion
Management can use monthly PMI results for strategic decision-making. For example, an automaker relies on new order projections to plan production and purchase materials like steel and plastic. Analyzing PMI trends helps businesses optimize resources, manage supply chains, and adapt to market shifts.
Suppliers can use PMI data to anticipate demand and adjust production accordingly. A parts supplier, for example, can track PMI to assess future orders and inventory levels, which influence manufacturing needs. PMI insights also impact pricing—when new orders rise, manufacturers may raise prices and accept higher costs from suppliers; when orders decline, they may lower prices and negotiate cost reductions. Beyond pricing and production, PMI helps businesses with budgeting, staffing, and cash flow forecasting, enabling them to navigate economic shifts more effectively.
The PMI reflected strong manufacturing performance within the U.S. economy, signaling resilience and expansion in the sector. Notably, key growth areas in the Sub-Indexes served as a highly positive indicator of continued momentum.
However, concerns remain regarding the potential impact of tariffs in the coming months. A critical question is whether the PMI will sustain its upward trend or if the January increase was driven by businesses rushing to place orders ahead of impending tariff changes. The long-term effects of these trade policies on manufacturing activity, supply chains, and overall economic growth remain uncertain, making future PMI readings an important gauge of industry stability.
Keep an eye out for the next PMI release, as it will provide valuable insights into economic trends, business conditions, and potential shifts in manufacturing activity. As well as insight to prices.
—Tom Schaefges, St. Onge Company